Microsoft Excel has many features that can help you make aggregating data or information. Pivot tables are one of the most powerful features of Excel. A pivot table is a great reporting tool that allows you to sorts and sums independent of the original data layout in the spreadsheet. This cuts down on the manual counting and human errors. Pivot tables are also useful for quickly creating unweighted cross tabulations.
Pivot Tables: How a pivot table works
Need more information, watch this excellent tutorial on Pivot Tables.
VLoopup
MS Excel has a function that allows you to find information in a table of data. Using a vloopkup returns a value from a table that you have in the workbook using the first column as your index or primary identifier, the table range and the column which contains the value to return. It's an excellent function for trying to assemble data for simpler viewing or referencing.
Here's an excellent video that covers vlookups.
Pivot Tables: How a pivot table works
- Find a spreadsheet you have with lots of data that include column headers.
- Select all the data in the worksheet by clicking in the box at the top left hand corner of the spreadsheet.
- Go to Insert and click on Pivot Table.
- It will verify the data selection and ask you if you want to create this on a new spreadsheet.
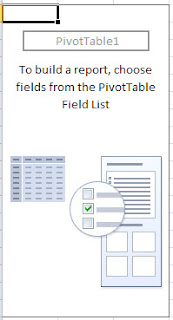
- On a new spreadsheet, you will see a new sheet with a box labeled Pivot Table 1.
- On the other end you will see a screen that has the fields. On the bottom of that you will see four items: Report Filter, Column Labels, Row Labels, and Values.
- Drag and drop the items you want at the top Column Labels. Then, what Values do you want counted.
- You will notice on your spreadsheet your data starts to display information.

Need more information, watch this excellent tutorial on Pivot Tables.
VLoopup
MS Excel has a function that allows you to find information in a table of data. Using a vloopkup returns a value from a table that you have in the workbook using the first column as your index or primary identifier, the table range and the column which contains the value to return. It's an excellent function for trying to assemble data for simpler viewing or referencing.
Here's an excellent video that covers vlookups.


Comments